棒グラフを描く
barplot(height, ...)
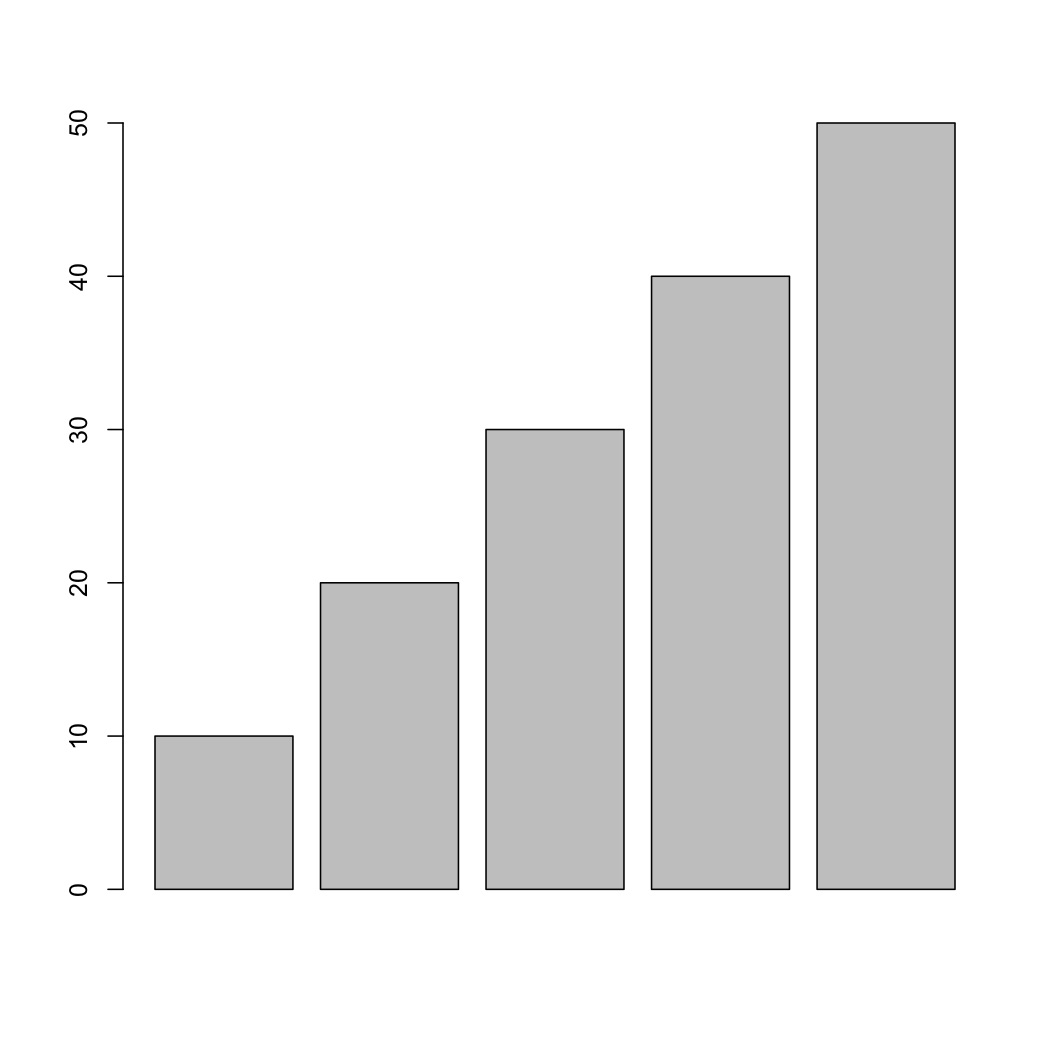
棒グラフを描くbarplot()関数にデータを渡す。
data <- c(10, 20, 30, 40, 50)
barplot(data)
凡例をつける
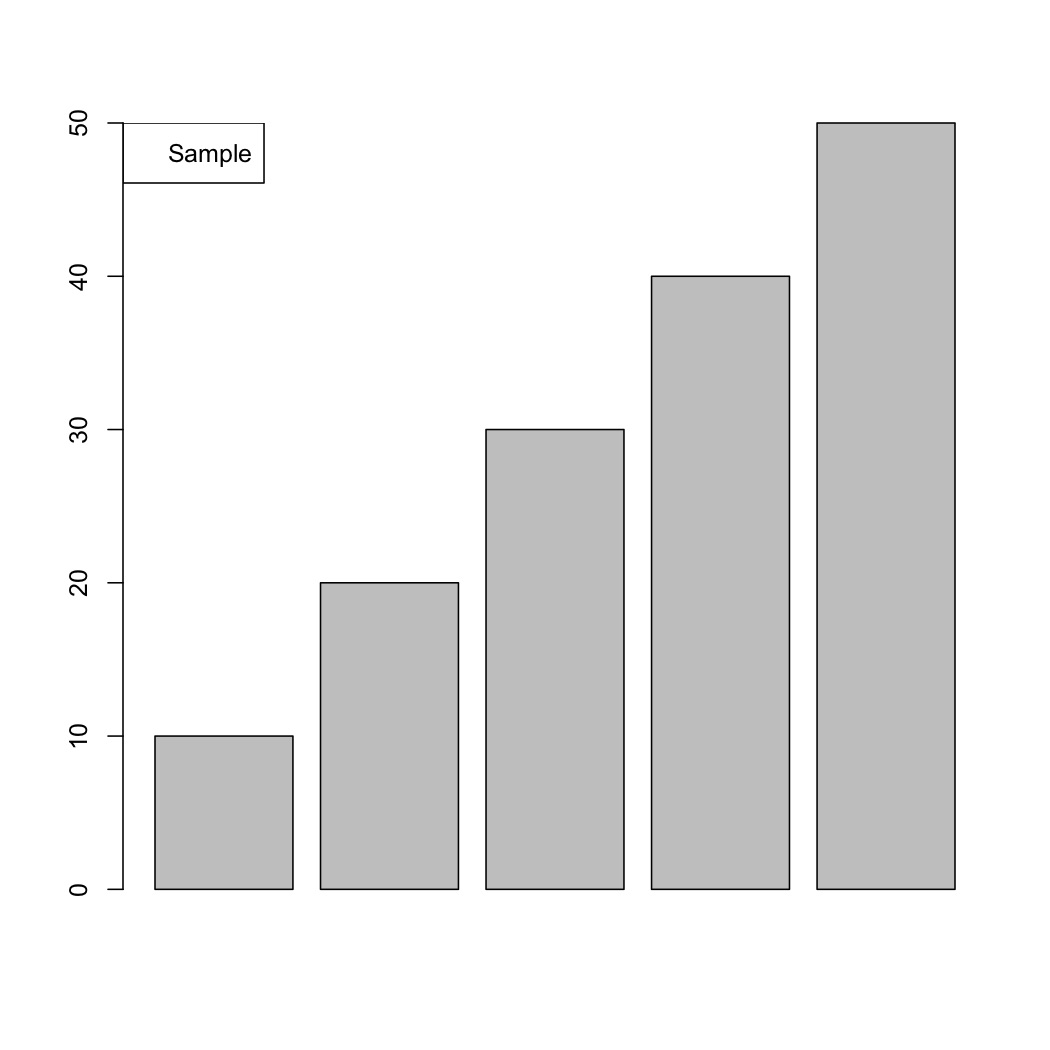
凡例(レジェンド)をつけるには、legend()関数を使用する。
barplot(c(10, 20, 30, 40, 50))
legend("topleft", legend="Sample")
凡例の位置を指定する
凡例の位置は、以下のキーワードで指定できる。
"bottomright"
"bottom"
"bottomleft"
"left"
"topleft"
"top"
"topright"
"right"
"center"
それぞれ以下のような位置に表示される。
barplot(c(10, 20, 30, 40, 50))
location <- c("bottomright", "bottom", "bottomleft", "left", "topleft", "top", "topright", "right", "center")
for (i in 1:9) {
legend(location[i], legend = location[i])
}
